Color Curves
Curves can be found under Filter ▸ Color Adjustment ▸ Curves, keyboard shortcut ⌘⇧M.
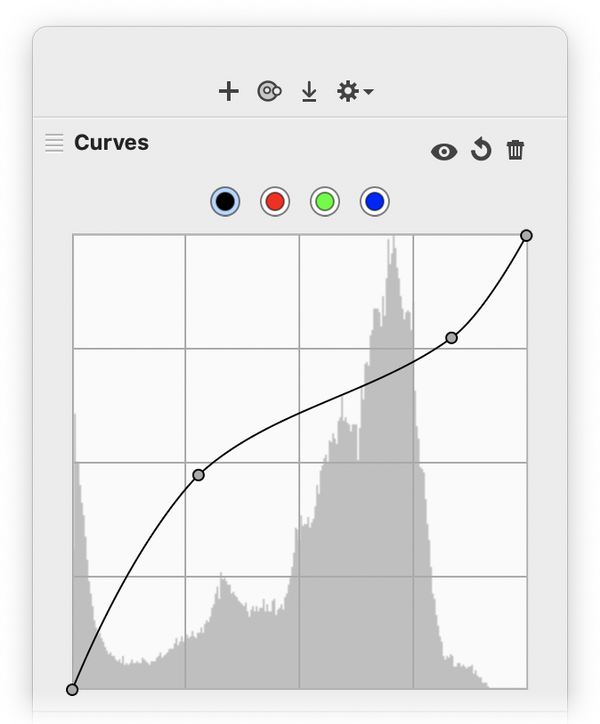
Curves allows you to non-destructively adjust an images’ tonal range or contrast by modifying the diagonal line on the graph via control points. The left portion of the x-axis represents the shadows of the image, while the right portion represents the highlights. The middle of the x-axis represents the mid-tones of the image.
Adding Control Points: To add a control point to the curve, click and drag on the diagonal line where you'd like to make your adjustment.
Deleting Control Points: Click and drag the control point off the graph.
![]() Curves Visibility: Click this button to toggle between the original image curve and the modifications you have made to the curve.
Curves Visibility: Click this button to toggle between the original image curve and the modifications you have made to the curve.
![]() Reset Curves: The reset button removes any changes you have made to the curve.
Reset Curves: The reset button removes any changes you have made to the curve.
![]() Remove Curves Filter: To completely remove the curves filter, hit the ‘trash’ button.
Remove Curves Filter: To completely remove the curves filter, hit the ‘trash’ button.
Creating a Curves Preset
Create your desired curve. Click on the action menu in the filters palette and choose ‘Save Filter Preset’. Give your filter a name and click save. Your preset can then be applied in the future by clicking on the action menu and navigating to the presets drop down menu.
Be sure to read up on the Filters tutorial to learn more about how filters work. You can stack the curves filter with endless combinations of other filters to create interesting and unique effects to your images non-destructively!
RGB Curve
The RGB curve can be seen by clicking on the first button at the top of the histogram. The RGB curve is where you can modify the lightness, darkness and contrast of the shadows, highlights and mid-tones of your image without affecting the color balance. The bottommost point of the curve in the lower left hand corner represents the blackest blacks while the upper righthand corner represent the whitest whites.
How to Darken/Lighten Highlights: To darken highlights add a control point near the top of the diagonal line and then drag the point downwards. To lighten highlights drag a point near the top of the line upwards.
How to Darken/Lighten Shadows: To darken shadows add a control point near the bottom of the diagonal line and then drag the point downwards. To lighten shadows drag a point near the bottom of the line upwards.
How to Darken/Lighten Midtones: To darken midtones add a control point near the center of the diagonal line and then drag the point downwards. To lighten midtones, drag a point near the middle of the line upwards.
How to Increase/Decrease Contrast: Dragging a control point to the left or right increases or decreases the contrast. Additionally, the steeper the curve between two points, the greater the contrast. Flattening the curve between two points decreases the contrast
How to Set the Black and White Points: To set the black point of your image (this represents the blackest black), drag the control point located at the bottom left hand side of the diagonal upwards. Dragging the black point upwards lightens the blacks in your image. If you drag the black point all the way to the top, the blacks in your image become white. To set the white point of your image (the whitest whites) drag the control point located at the upper right hand side of the diagonal downwards. This will darken the whites, and if you drag it all the way to the bottom the whites in your image will become black.
RGB Examples: The most common curves used to correct the tonal range of an image are the S-Curve and inverted S-Curve. The S Curve darkens the shadows and lightens the highlights, while the inverted S-Curve does the opposite.
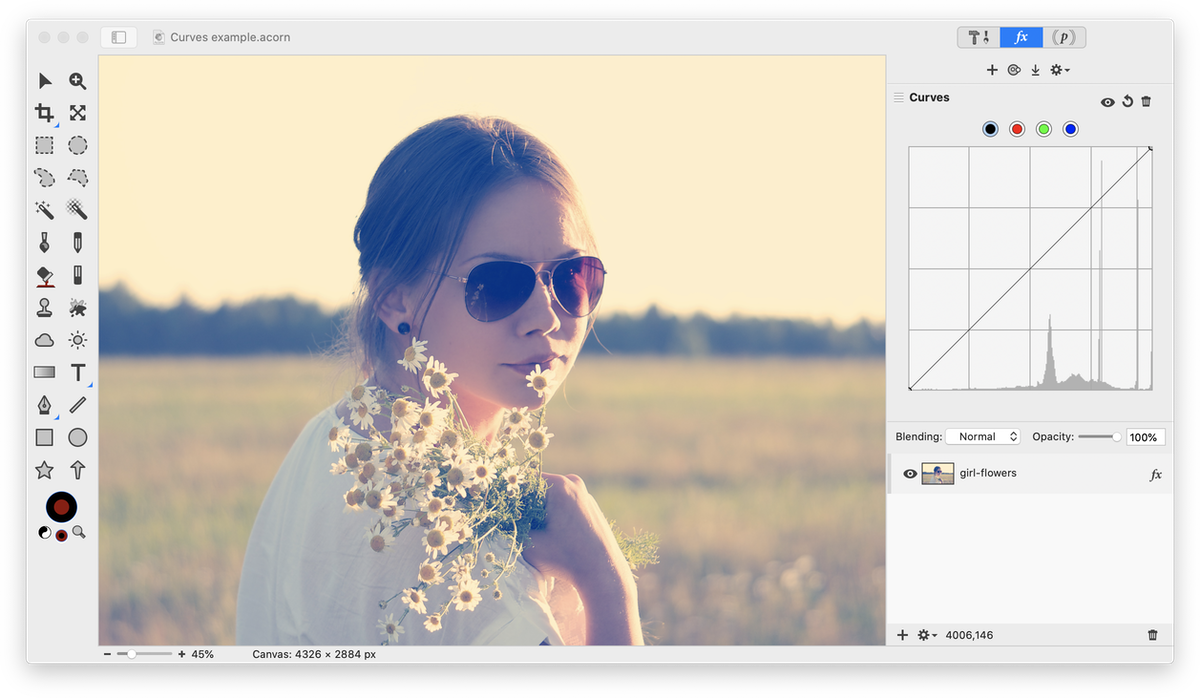
Original
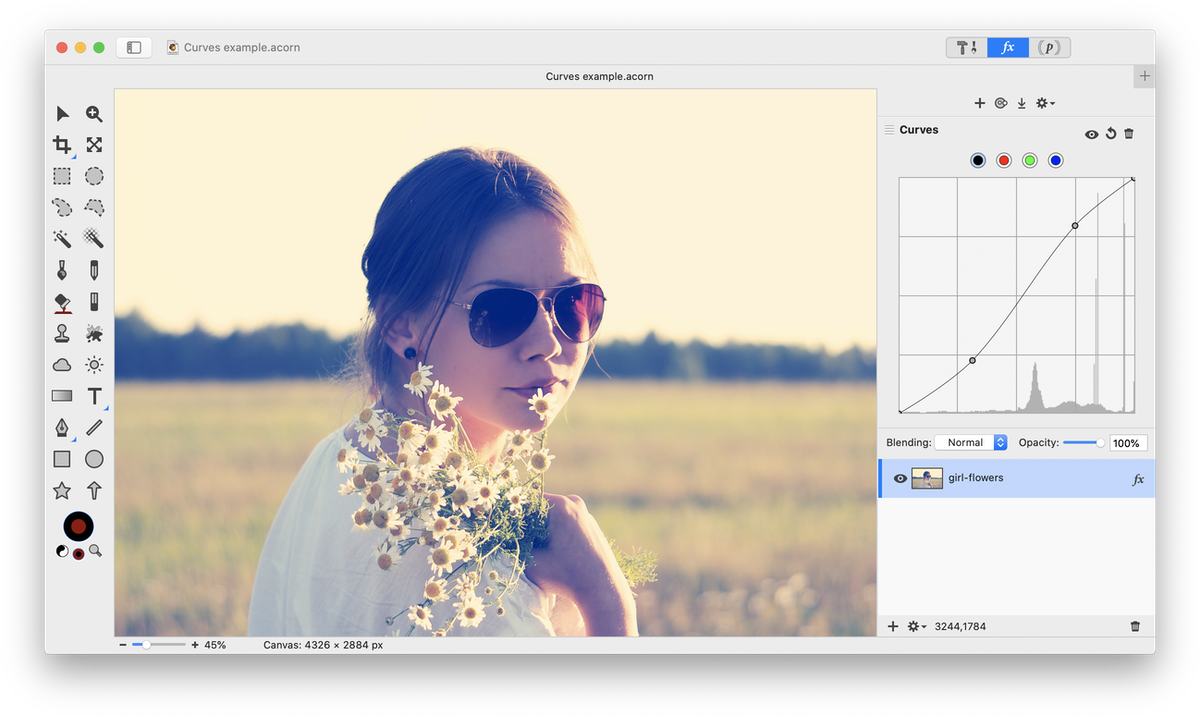
S Curve to Darken Shadows and Lighten Highlights
Individual Color Channel Curves
The individual color channel curves are available by clicking one of the buttons along the top of the histogram. You can modify the red, green and blue color balance in an image to create a "warmer" or "cooler" effect. The principles are the same as for the RGB curves, except you are focusing on a single color's shadows, midtones, and highlights with each curve.
The image of an aurora borealis is used here to demonstrate how modifying the red, green, and blue curves can affect the appearance of an image.
Original image.


Additional Relevant Documentation
Introduction to Curves (video tutorial)